|
|
new
Spectra View
Here you can
create a new spectra view, which is the general tab type for displaying
and processing all kind of spectra. Change the tab name after
double-clicking on it. Change the tab order by drag&dropping
tabs. Tabs can be dragged out of the main window as separate windows
and docked into it again afterwards, but not all functionality
is available for such separated tabs. Each view type has its own
characteristic set of inline buttons at the top (explained with
their respective ribbons).
Spectra View
function buttons

These inline
buttons are part of all Spectra tabs, even of those special tabs
used for another purpose, like in Automate, Acquire and Identify
areas. Here are the explanations:
-  :
explains all available zooming and other plot interaction functions
with mouse buttons :
explains all available zooming and other plot interaction functions
with mouse buttons
-  :
For zooming in with the left mosue button, here you can switch
between vertical, horizontal or bi-directional zooming. With "Zoom
history" activated, the zooming out (with right mouse button)
goes the same steps backwards, that were used on zooming in. :
For zooming in with the left mosue button, here you can switch
between vertical, horizontal or bi-directional zooming. With "Zoom
history" activated, the zooming out (with right mouse button)
goes the same steps backwards, that were used on zooming in.
-  :
Functions for selecting axis types and spectrum line type, as
explained in Plot/Views. :
Functions for selecting axis types and spectrum line type, as
explained in Plot/Views.
-  :
Functions for legend handling, as explained in Plot/Views. :
Functions for legend handling, as explained in Plot/Views.
-  :
Get spectral data in with "Paste form Clipboard", get
a plot image out with "Copy Plot to Clipboard" and get
spectral data out with "Copy data to clipboard", as
explained in File. :
Get spectral data in with "Paste form Clipboard", get
a plot image out with "Copy Plot to Clipboard" and get
spectral data out with "Copy data to clipboard", as
explained in File.
-  :
Copy a single spectrum to another tab by grabbing the spectrum
trace with the left mouse pointer and dragging it to another tab
header. :
Copy a single spectrum to another tab by grabbing the spectrum
trace with the left mouse pointer and dragging it to another tab
header.
-  :
Duplicate the current tab with all spectra content into a new
tab as a copy. Great for "branching" needs in processing,
also consider Undo/Redo functions. :
Duplicate the current tab with all spectra content into a new
tab as a copy. Great for "branching" needs in processing,
also consider Undo/Redo functions.
-  :
Show spectrum properties for the currently selected, similar to
the functions from Display & Data properties. Change the selected
spectrum by clicking on the spectrum trace or its legend entry. :
Show spectrum properties for the currently selected, similar to
the functions from Display & Data properties. Change the selected
spectrum by clicking on the spectrum trace or its legend entry.
-  :
Show a print preview and print the current plot from there. :
Show a print preview and print the current plot from there.
-  :
Undo and Redo the previous processing step. Define the size of
Undo/Redo stack from File > Options. :
Undo and Redo the previous processing step. Define the size of
Undo/Redo stack from File > Options.
|
| <jump
back to top> |
|
|
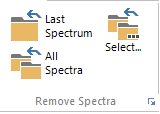
Remove
Spectra
Last Spectrum:
remove the last spectrum in the current's tab spectrum list. Short
key: BACKSPACE.
All Spectra:
remove all spectra from the current tab. Short key: SHIFT+DELETE.
Select...:
Select one or several spectra for deletion in the left side list
and move them to the right side list with the buttons in the middle.
The OK button will execute the actual removal. Short key: DELETE.
|
| <jump
back to top> |
|
|
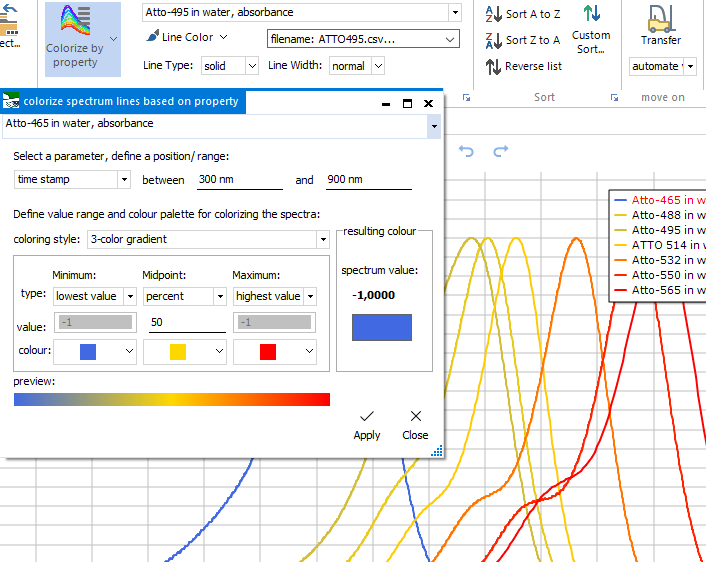
Colorize
by property
Colorize a series
of spectrum traces, based on the chosen parameter and the defined
coloring style. Activate/ deactivate the function by clicking
the main button, select the options from the dropdown menu.
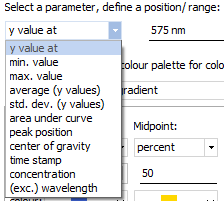 |
As
parameter, you can select:
- y value (at a defined position)
- minimum value (in a defined range)
- maximum value (in a defined range)
- average of y values (in a defined range)
- standard deviation of y values (in a defined range)
- area under curve (in a defined range)
- peak position (in a defined range)
- center of gravity (in a defined range)
- time stamp (for a series with time stamps assigned)
- ... |
Choose from
a number of coloring styles, and several ways of mapping the colors
to values (with auto-ranging or else manual setting the boundaries).
On the right side, there is a color preview for the spectrum trace
selected in the top dropdown selector. With the Apply button,
the current settings are applied to the current spectra series.
The window only closes after clocking onto the Close button.
This is perhaps one of the most underrated Spectragryph
functions. Use it for great insight!
|
| <jump
back to top> |
|
|
Spectra
Properties
For the spectrum
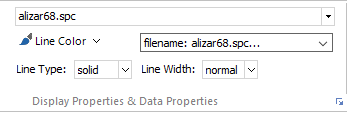
selected in the top dropdown selector, you can quickly set:
- the line colour ( from the dropdown color selector)
- the line type: solid, dashed or dotted
- the line width: ranging from "normal" and "+1"
up to "+6". The line width is used as a relative width
offset from the overal plot line width, which can be set with
the "Lines thicker" and "Lines thinner" buttons
from the Plot/Views
ribbon
For the same
selected spectrum, show the spectrum information from the second
dropdown selector.
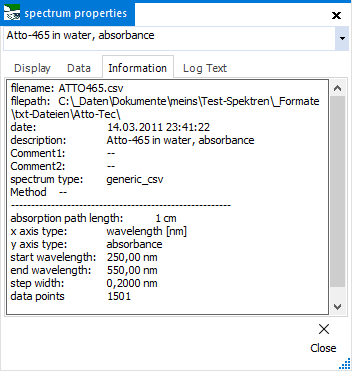
Click on the
down-right options arrow to show the spectrum properties window,
with access to "Display", "Data", "Information"
and "LogText" sections for the current spectrum. Switch
between spectra with the top dropdown selector.
- the "Display" area allows to assign individual line
color, width and type. Optionally, assign the same color to all
spectra.
- the "Data" area allows to assign individual spectrum
names, and values for (excitation) wavelength, measurement temperature,
concentration and path length; and also to calculate a sampel
concentration from weighing in
- the "Information" area shows the same content as the
second dropdown selector from the ribbon
- the "Log Text" areas is used for keeping meta data
for some file formats, for keeping measurement parameters for
acquired spectra and for bearing meta data and molecular structure
information for library spectra
|
| <jump
back to top> |
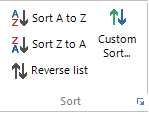 |
Sort
spectra
For changing
the order of the currently loaded spectra.
- "Sort A to Z" will sort alphabetically, based on legend
texts
- "Sort Z to A" will sort inverse alphabetically, based
on legend texts
- "Inverse List" will invert the current order, ignoring
any other sorting criterium
|
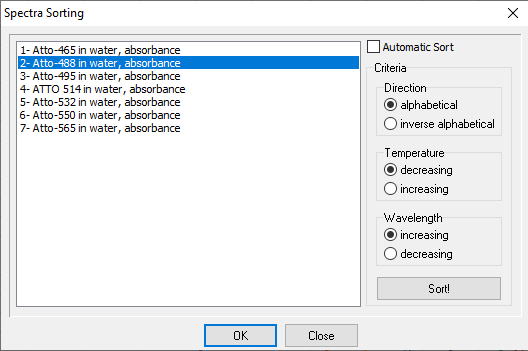 |
With the Custom
Sort window, you can put a series of spectra in your own customized
order. Select a single spectrum or several spectra, then move
them to their new place in the list with the right mouse button.
The "Automatic
sort" section on the right side has again the alphabetical
and inverse-alphabetical sorting criteria, as well as temperature
and wavelength, which are probably not used anyone outside a very
narrow range of users:-)
|
| |
<jump
back to top> |
|
|
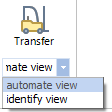
Transfer
spectra
The little yellow
fork truck  helps to quickly transfer a selected or all spectrum to other
specialized tabs, without the need of saving it first and the
loading into the other tab.
helps to quickly transfer a selected or all spectrum to other
specialized tabs, without the need of saving it first and the
loading into the other tab.
- if "automate
view" is selected, all spectra get transferred into the most
recent Automation tab for automated processing. If none is present,
a new automation tab will be created.
- if "identify view" is selected, the currently selected
spectrum gets transferred into the most recent Indentification
tab as sample spectrum for library seach. This only works, if
an Identificaton tab with a loaded library exists.
|
| <jump
back to top> |
|
![[SpectraGryph]](gryphon_white_green_96.png "back to SpectraGryph main page")


