Spectragryph
explained. All functions. All tricks. (under development...)
|
Some
general remarks: the Spectragryph user interface (UI)
is organized much like the Microsoft Office ribbon design,
which was first introduced with Office 2007. Nearly all functions
are available through icon-buttons and organized in multiple thematic
ribbons, which are further subdivided in thematic sub-areas and
sometimes have option arrows for fine-tuning the settings. The button
image style is basically flat and a mixture of Office 2013/2016-like
buttons and Win10-like icons. Anyone using current MS Office products
will feel at home immediately.
As a reminiscence to the old menu-style, each ribbon has a "Menu"-button
on the left side, that allows access to the same functions but organized
into a old-style drop down menu. For menu-style die-hards, it is
even possible to switch to a menu-only UI, by activating the "Old
style menu" option from the "App style" area within
the "Plot/View" ribbon. From the same area, it is possible
to switch between some varying coloring and surface schemes, ranging
from Office 2010 to Office 2019. I personally recommend to stay
with Office2016 and play with the "Color" setting...
|
All buttons show
explanatory hints on hovering with the mouse. Active buttons
look different from inactive ones, while their color depends on
the coloring scheme. The display of imported data and spectra is
organized in various types of views, arranged in tabs (like
Excel or a web browser). Each view type brings its individual
series of buttons, which may double buttons from some ribbon
above. A series of quick access buttons is always visible
and usable at the top.
Many functions have associated short keys, which may be used
from the keyboard anytime. From the "File" section, the
file and data import/export functions are available, as well as
printing, permanent setting of options, recalling recent files and
folders, information on the software and some more.
Even more than its predecessor Spekwin32, Spectragryph is Ninja
software. Which means it will immediately do what you want and
not ask any "Do you really want to..." questions. Learn
to use it!
|
| And
now, just click below on your area of interest and learn more! |
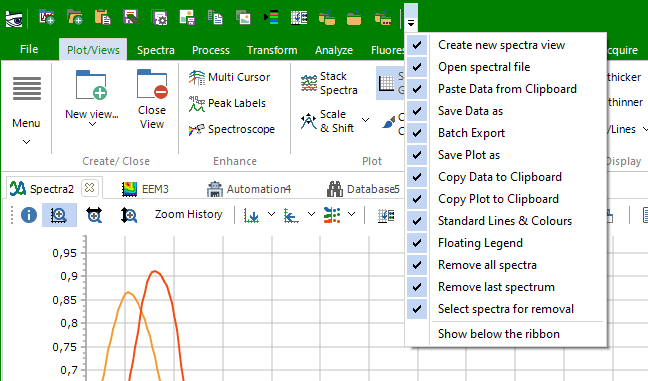 |
Quick
access buttons
The row of quick
access buttons give combined access to some of the most used functions
from the "File" area and the "Plot/Views"
and "Spectra" ribbons.
They can individually be shown/hidden from the right drop down
menu. The location may be switched to beneath the ribbon bands.
Below the quick
access buttons there is the ribbon band area, providing most Spectragryph
functions in form of buttons. There are a number of ribbons with
thematicall grouped functions buttons. Just click on each ribbon's
name for descriptions.
|
| <jump
back to top> |
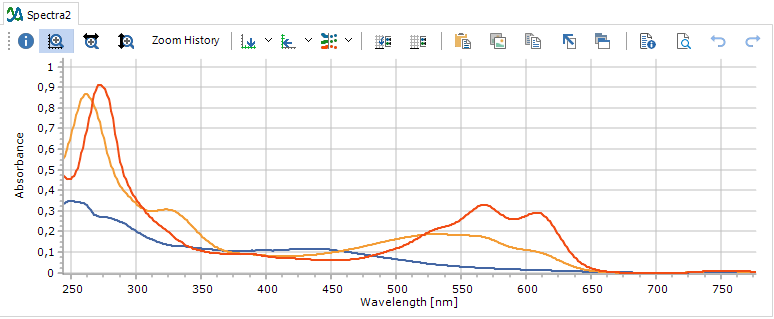 |
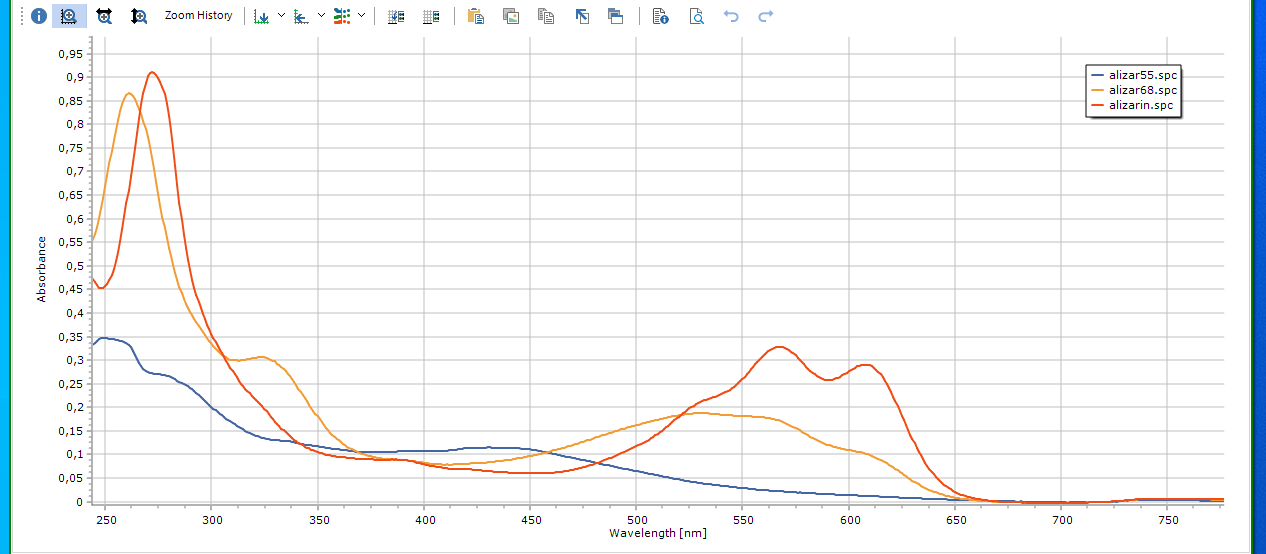
Spectrum
plot area
Topmost there
is the tab indicator showing the tab name and type. Tabs can be
moved around to change their order. Tab names can be changed by
doubleclicking and entering a text. Tabs can be closed by clicking
their Close symbol or with CTRL+W. Tabs can be undocked
from the main window by dragging the tab indicator away. Not all
functions are available for undocked plot tabs. For bringing them
back, grab the tab indicator and move it back into the main window's
row of tab indicators.
Next comes a
button row, giving quick access to often used functions for spectral
plots. The ( i ) button explains
all keyboard/mouse options for zooming in/out, scrollling and
panning around the plot. With the three buttons for zoom direction,
you can define the active axes for zooming and scrolling. The
"Zoom History" button allows to zoom out step-wise in
the order of the previous zooming-in steps. All other buttons
are also part of the "Plot/Views" ribbon and are explained
there.
The legend box
can be moved around with the left mouse. Clicking on a legend
entry will highlight the associated spectrum trace. Clicking onto
a spectrum will highlight the associated legend entry. Clicking
onto a spectrum trace with CTRL + LeftMouse will permanently
remove it! Double-clicking onto an axis name will bring up
a window for entering a custom axis title. These can be shown/
hidden by activating the "Custom Titles" button from
the "Plot/Views"
ribbon.
The current
mouse tip position is always shown as x value/ y value pair in
the lower status bar.
|
| <jump
back to top> |
 |
Status
bar
The left part of
the status bar always shows the number of spectra loaded in the
current spectra view. In the middle there is a live display of the
current mouse tip position, with values given in the axis types
of current spectrum plot.Between those two fixed positions, the
room is used for intermittent information, like current number of
read spectra while opening many spectra at once and the like.Additionally,
there is a display of memory usage and the time consumed by certain
processing functions. |
| <jump
back to top> |
|
![[SpectraGryph]](gryphon_white_green_96.png "back to SpectraGryph main page")