 |
 |
 |
 |
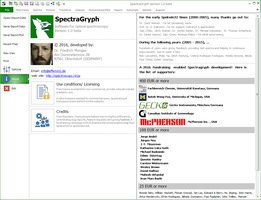
| Spectragryph
icon, as used on desktop |
Splash
screen, on starting up |
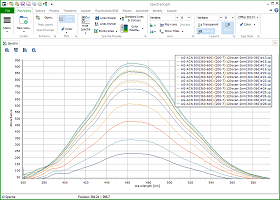
SpectraGryph
main window, with ribbon menu, quick access toolbar, spectrum view
window, ... |
A
classic dropdown menu is mingled into the ribbon interface, one for
each ribbon bar |
 |
 |
 |
 |
| Customizable
quick access toolbar. Can be displayed both above or below the ribbon
band |
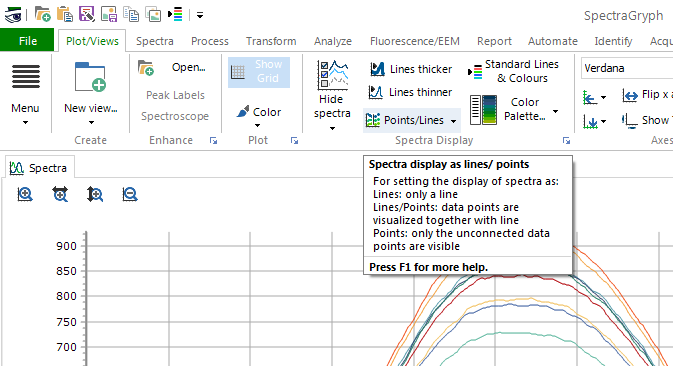
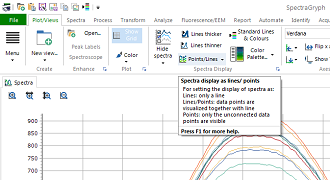
Office-like
hint boxes, with explanations for all icons |
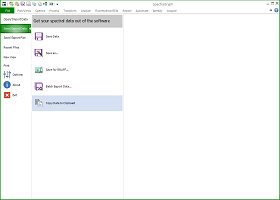
File
menu, giving access to all data/ plot input/ output operations, plus
some other functions |
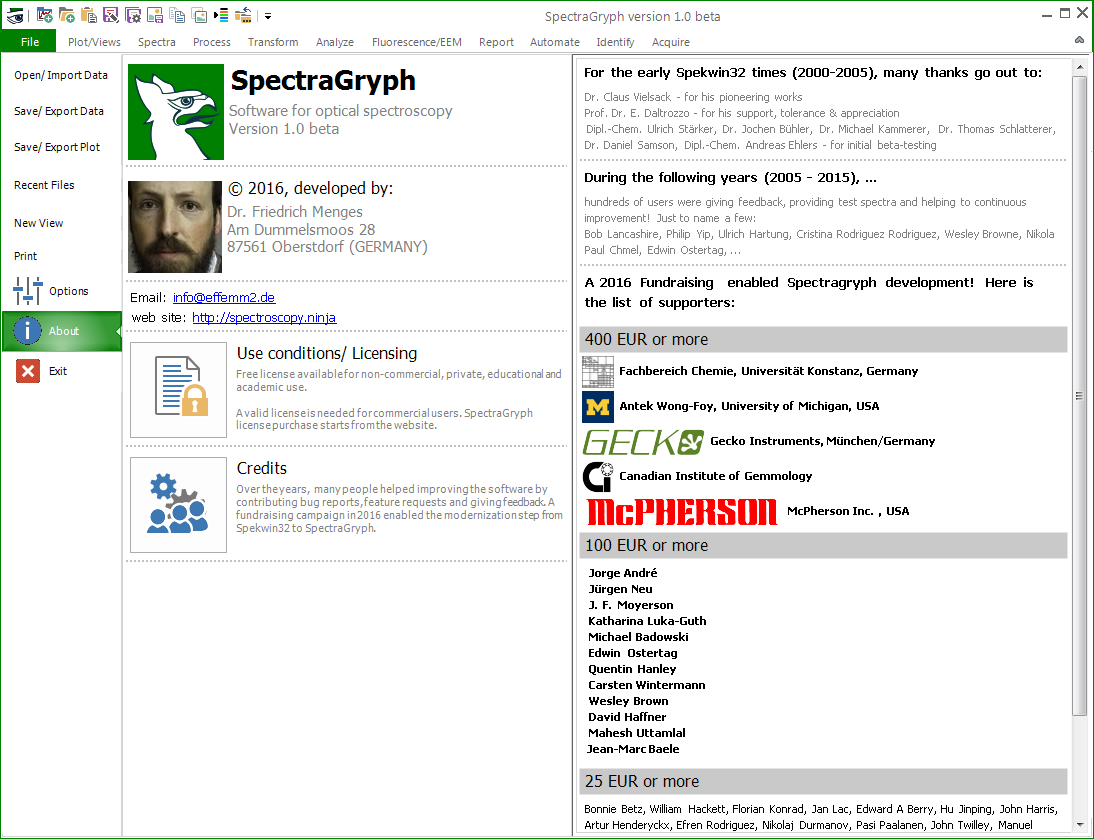
The
"About" part from the file menu |
 |
 |
 |
 |
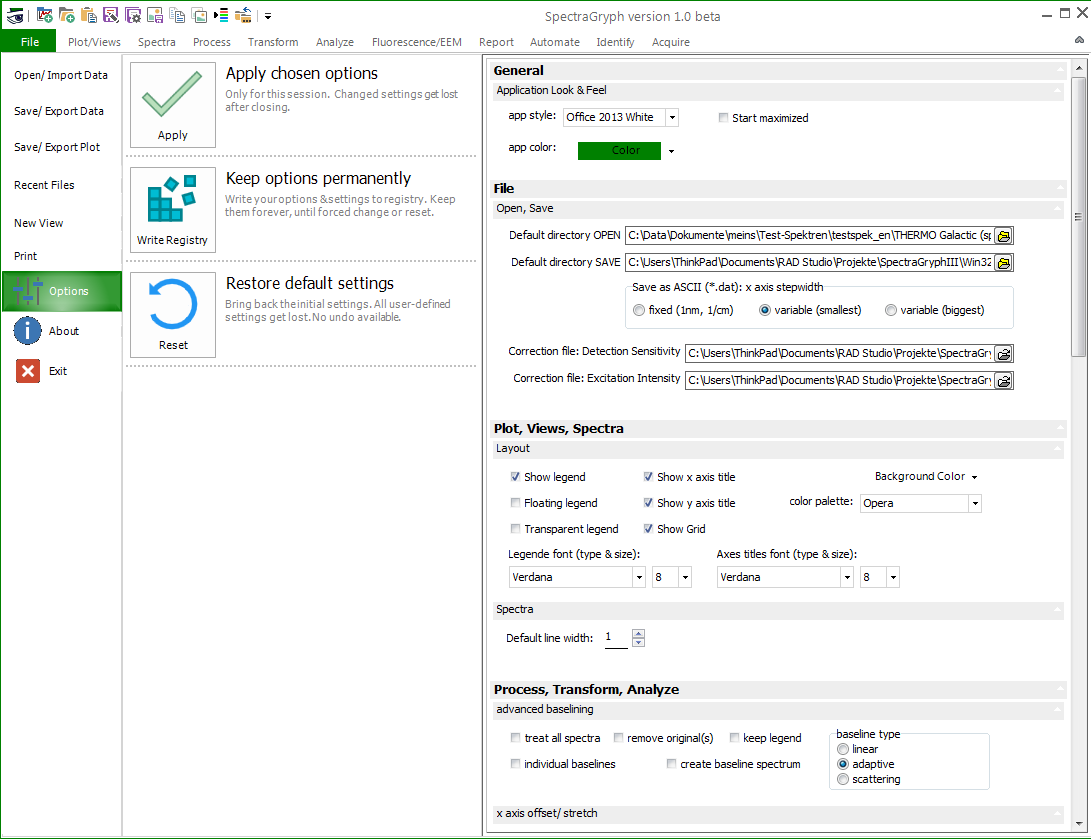
| Huge
amount of optional settings available, to be stored permanently in
registry. |
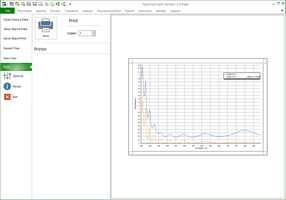
Print
preview dialog, not yet finished |
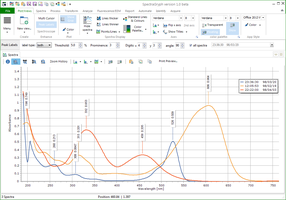
Automated
peak labeling as known from Spekwin32, with all the configuration
options. Will be enhanced with individual labeling. |
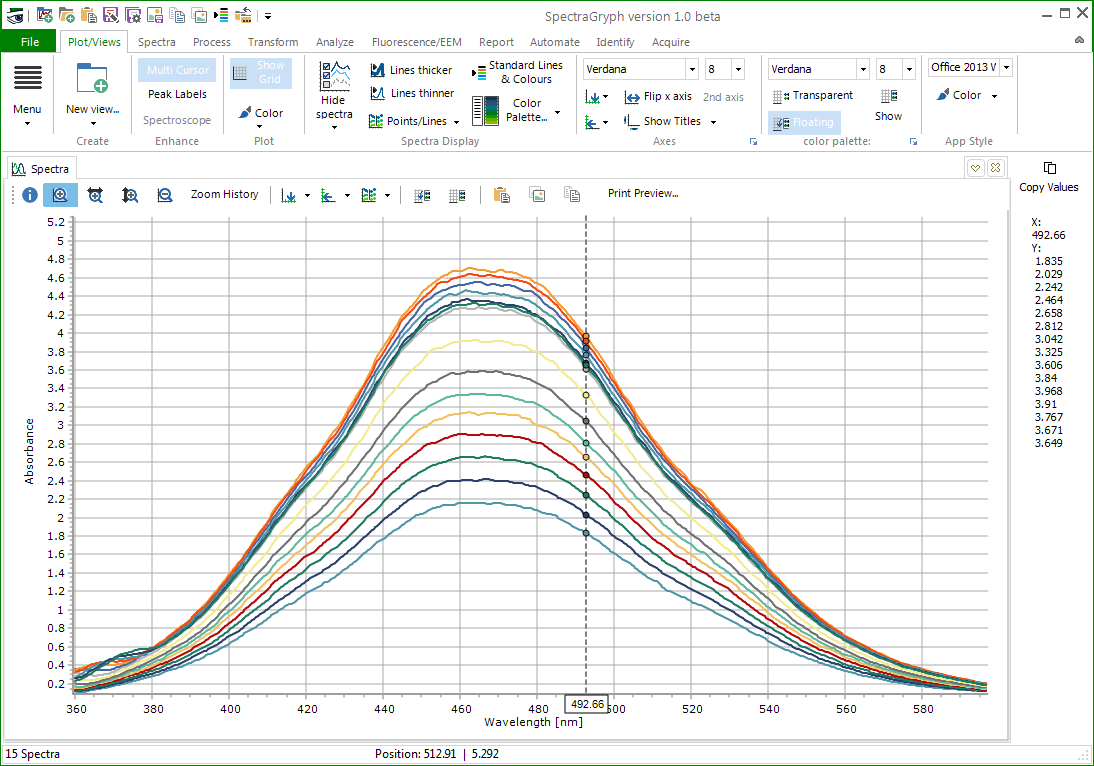
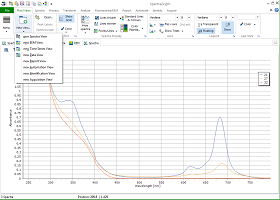
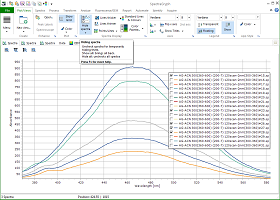
Movable
multi cursor reads all y values for a certain x value simultaneously |
 |
 |
 |
 |
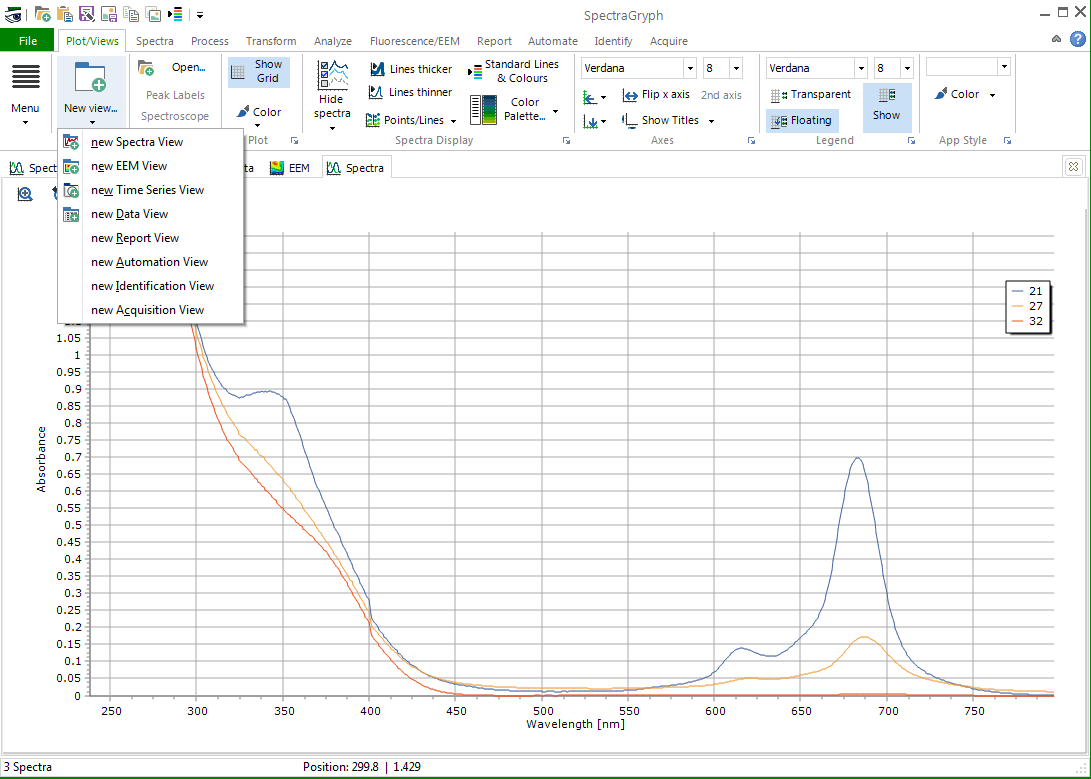
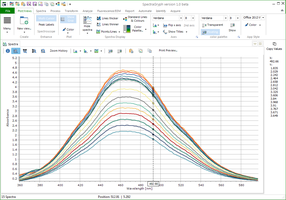
| Multiple
view windows of multiple types possible. |
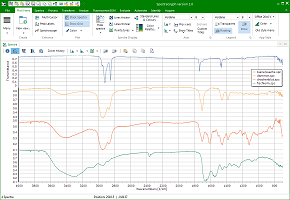
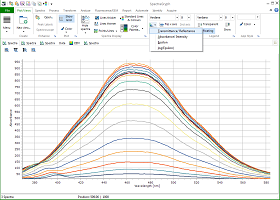
"stacked
view" for spectra. App style is "Office 2016" with
green colour |
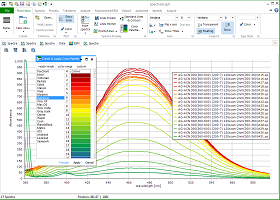
Changing
color palette for spectral lines |
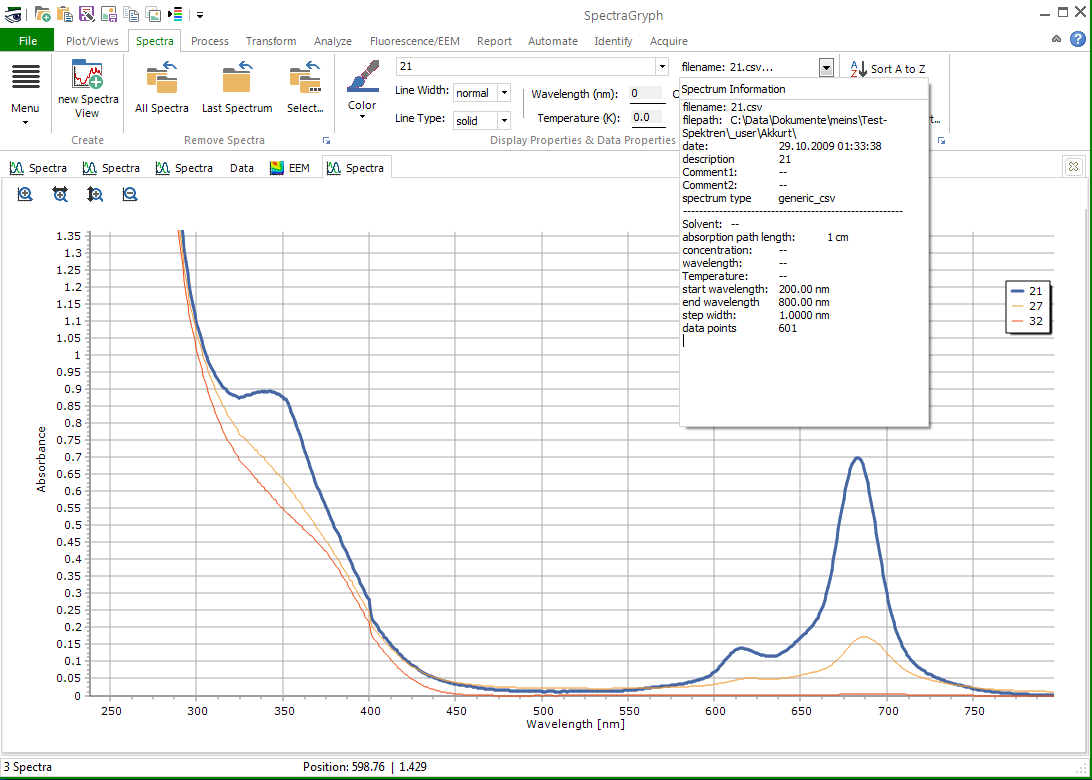
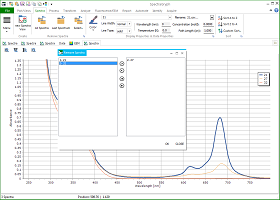
Showing
spectra properties for a selected spectrum from the "Spectra"
ribbon bar |
 |
 |
 |
 |
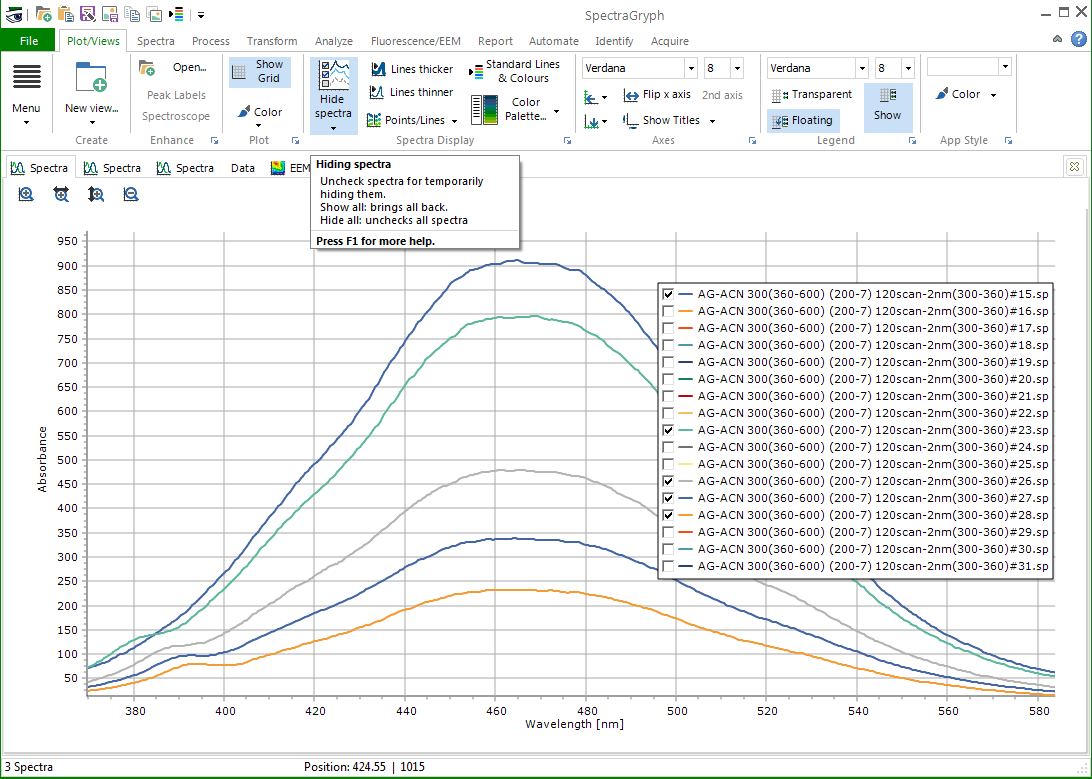
| Unselecting
spectra for hiding temporarily |
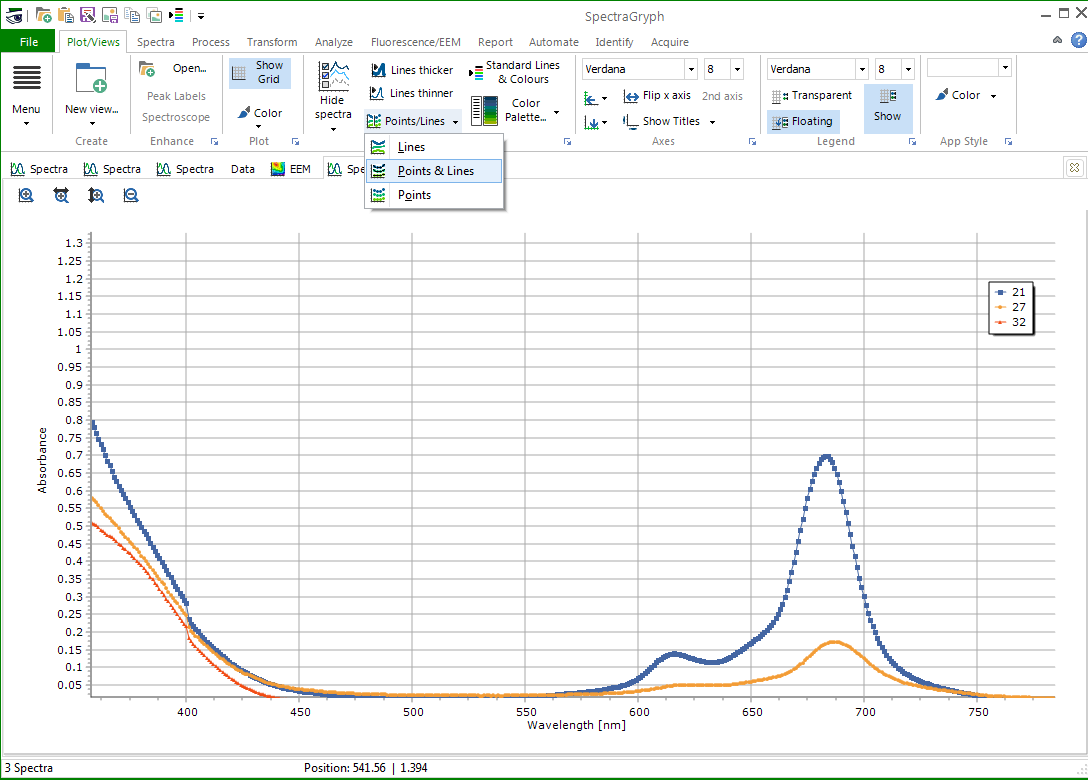
Changing
spectral line styles |
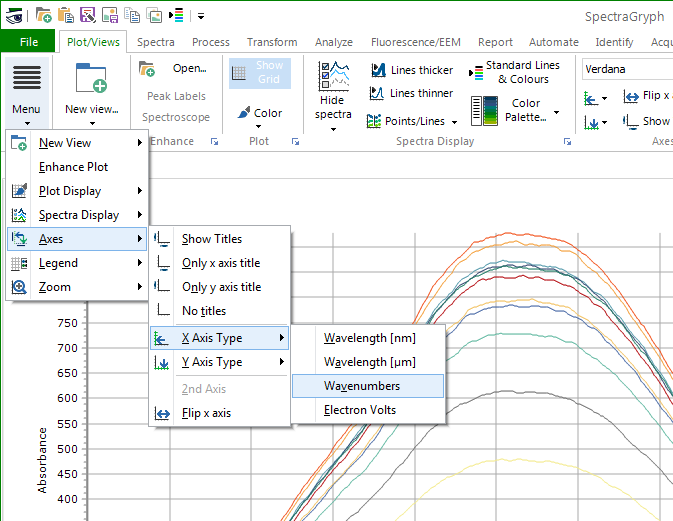
Quick
change of axis types |
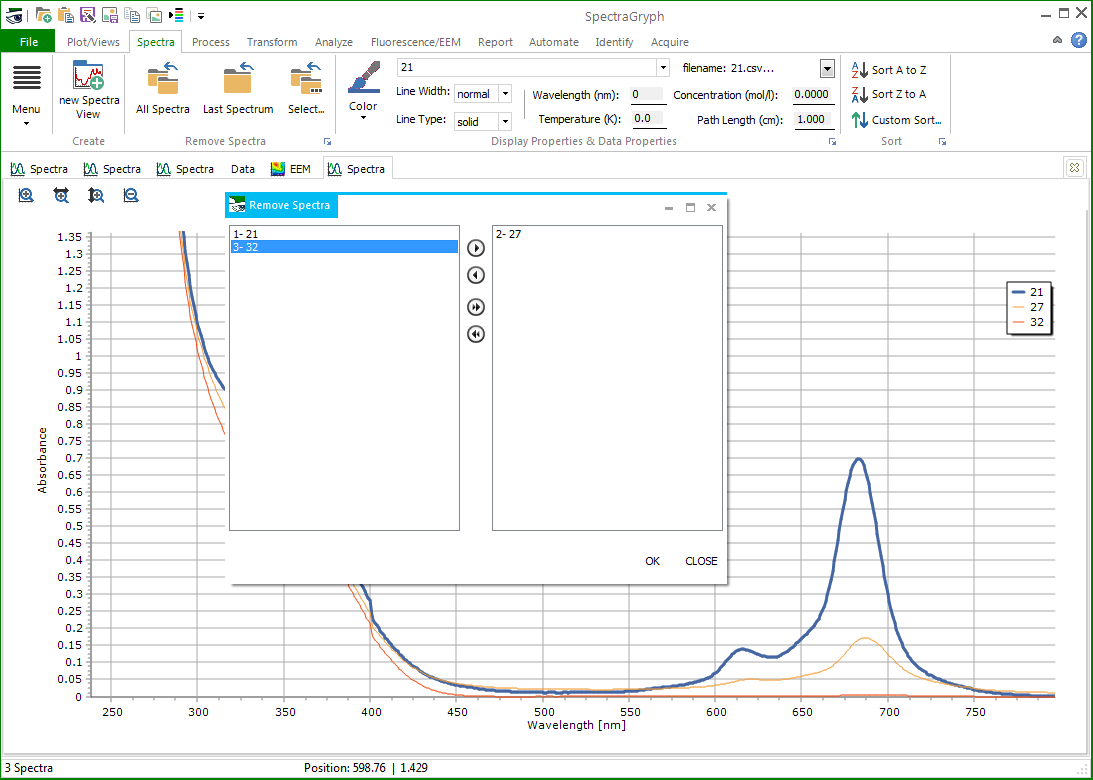
Selecting
spectra for removal |
 |
 |
 |
 |
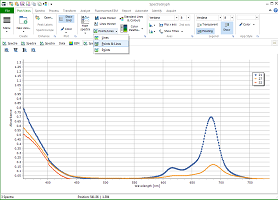
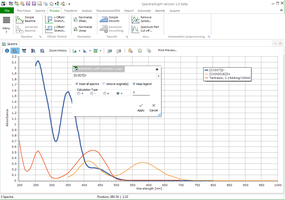
| The
"Process" ribbon bar, together with the window for doing
y offset/ stretch |
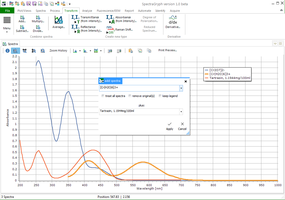
The
"Transform" ribbon bar, together with the window for adding
spectra |
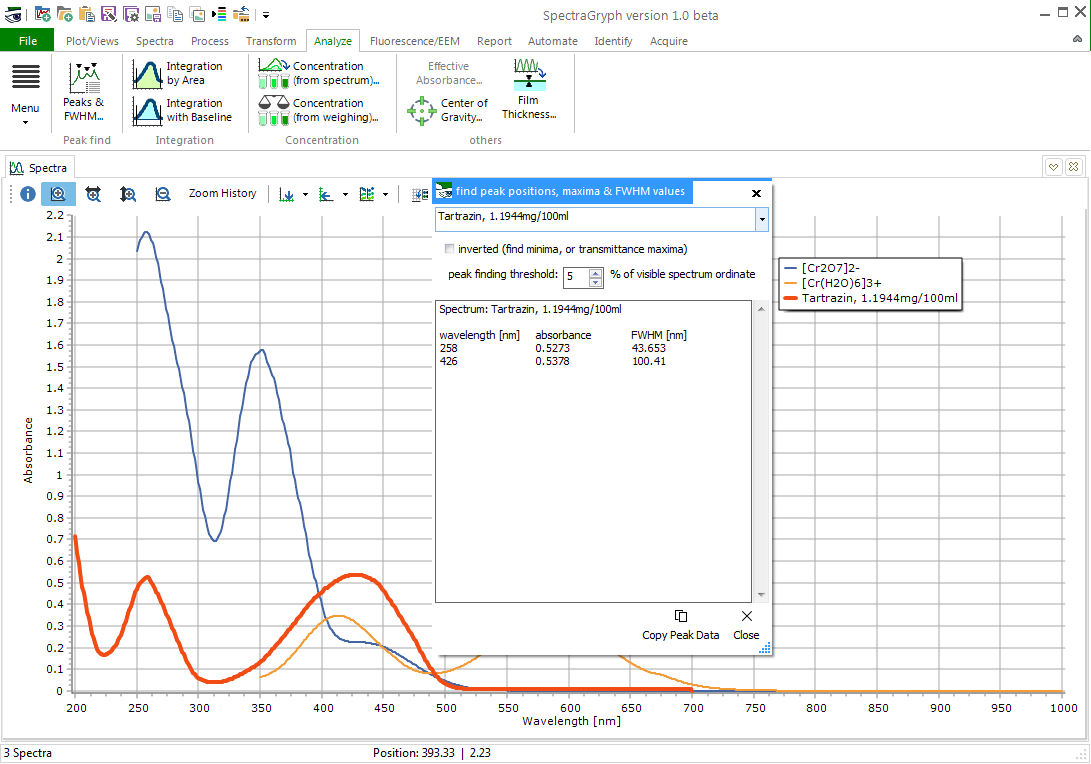
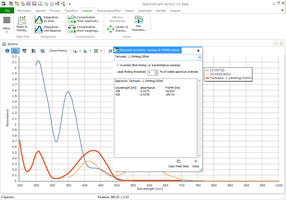
The
"Analyze" ribbon bar, together with the Peak/ FWHM listing
window |
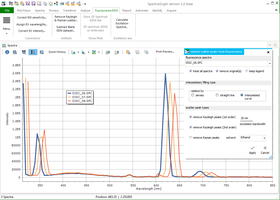
The
"Fluorescence/EEM" ribbon bar (icons to be done), together
with scatter removal window. |
 |
 |
 |
 |
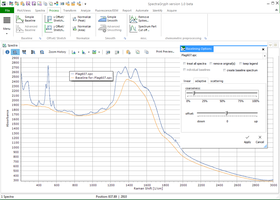
| Advanced
baseline window, three different baselining algorithms. Batch baseline
subtraction with individual baselines |
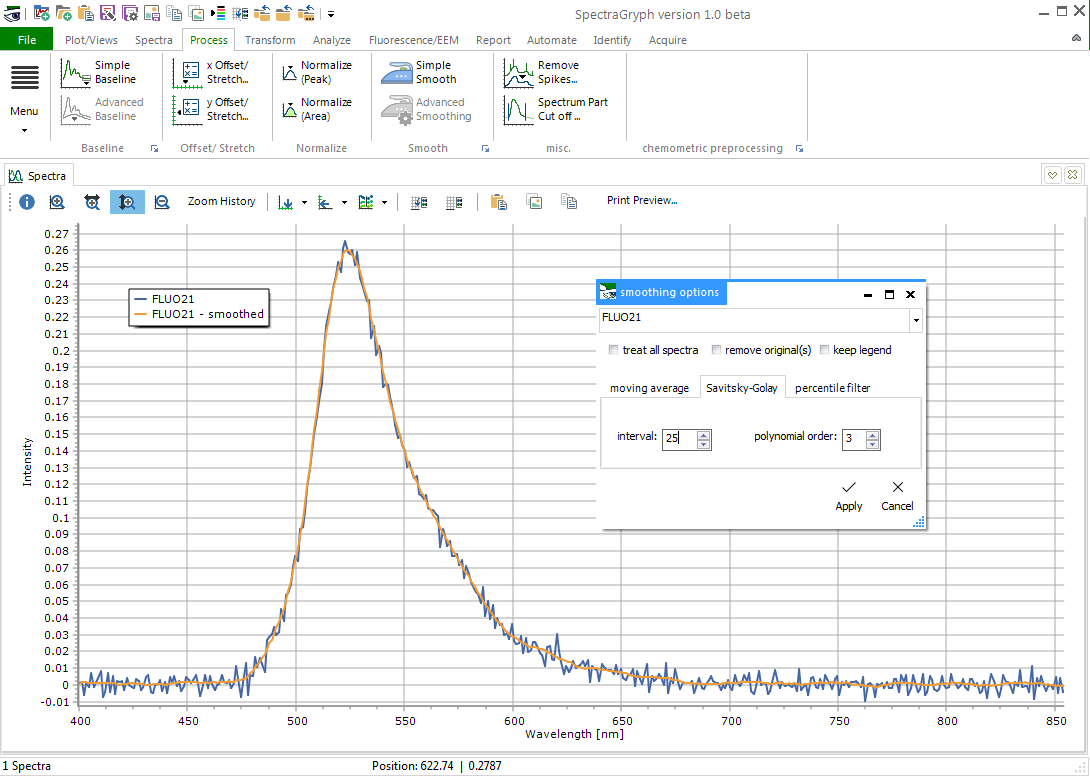
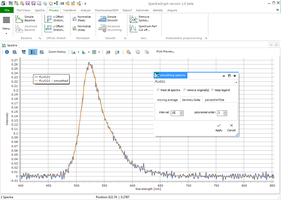
Advanced
smoothing window, three different smoothing algorithms, two parameters
each |
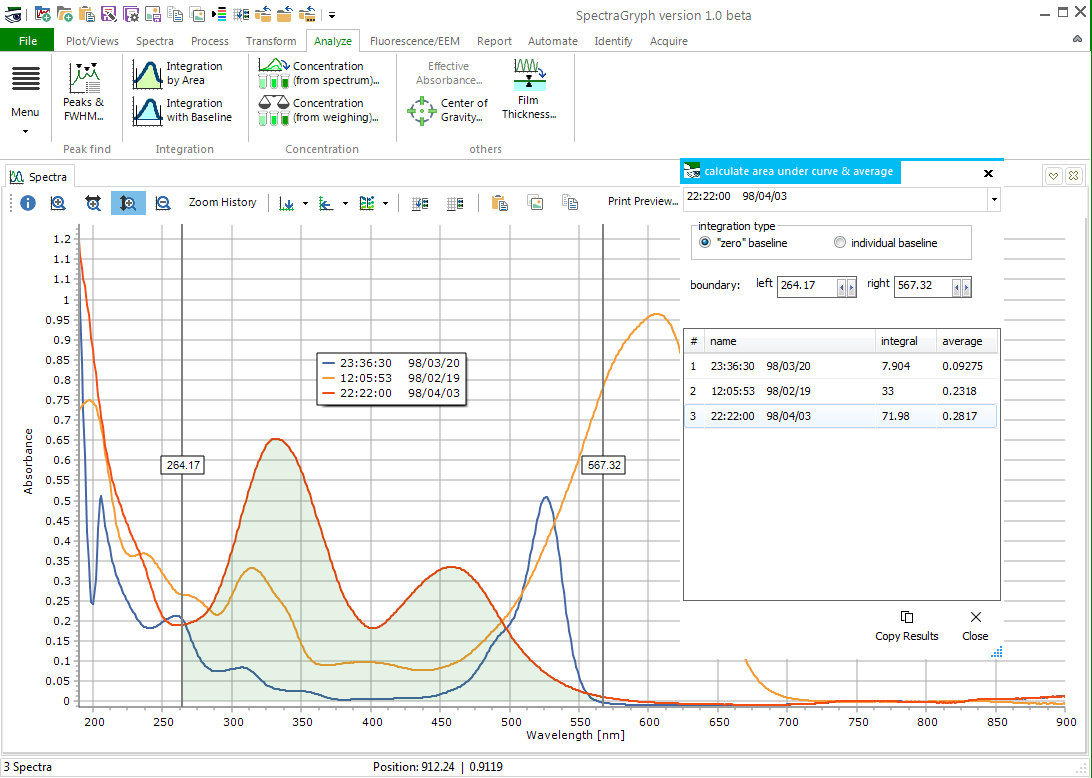
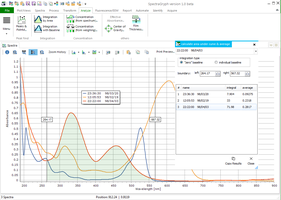
highly
interactive integration function, calculate integral for all spectra
at once |
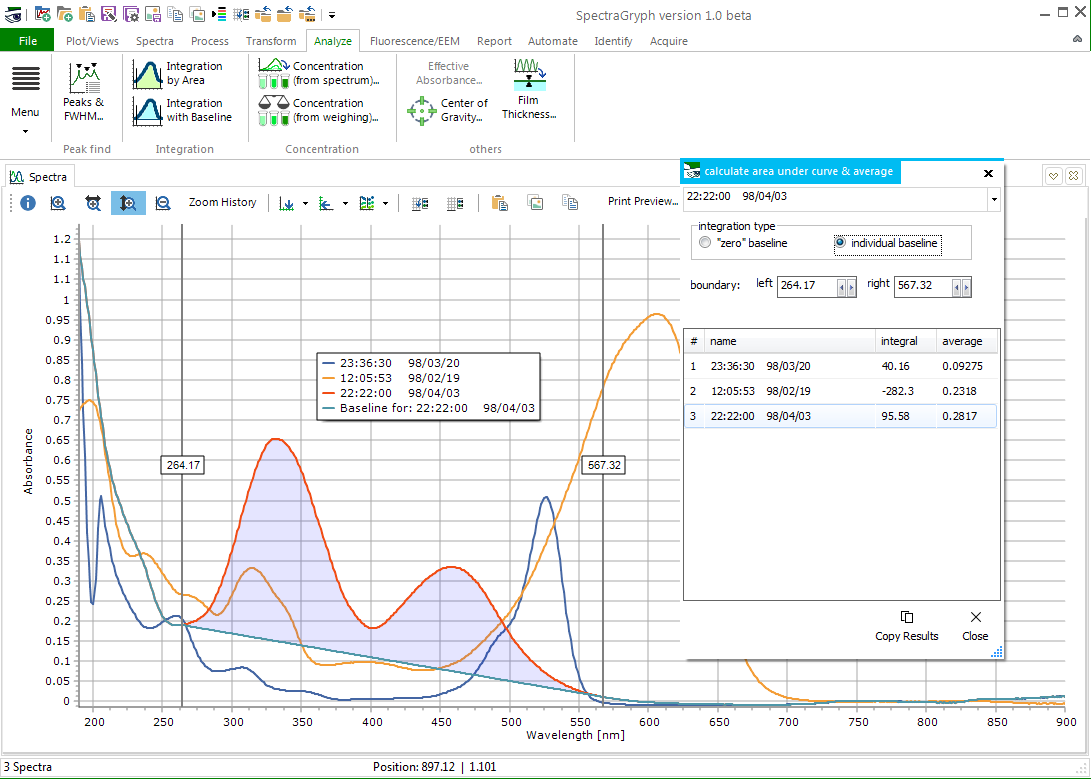
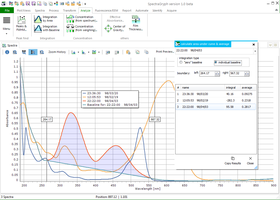
integration
function with individual baseline |
 |
 |
 |
 |
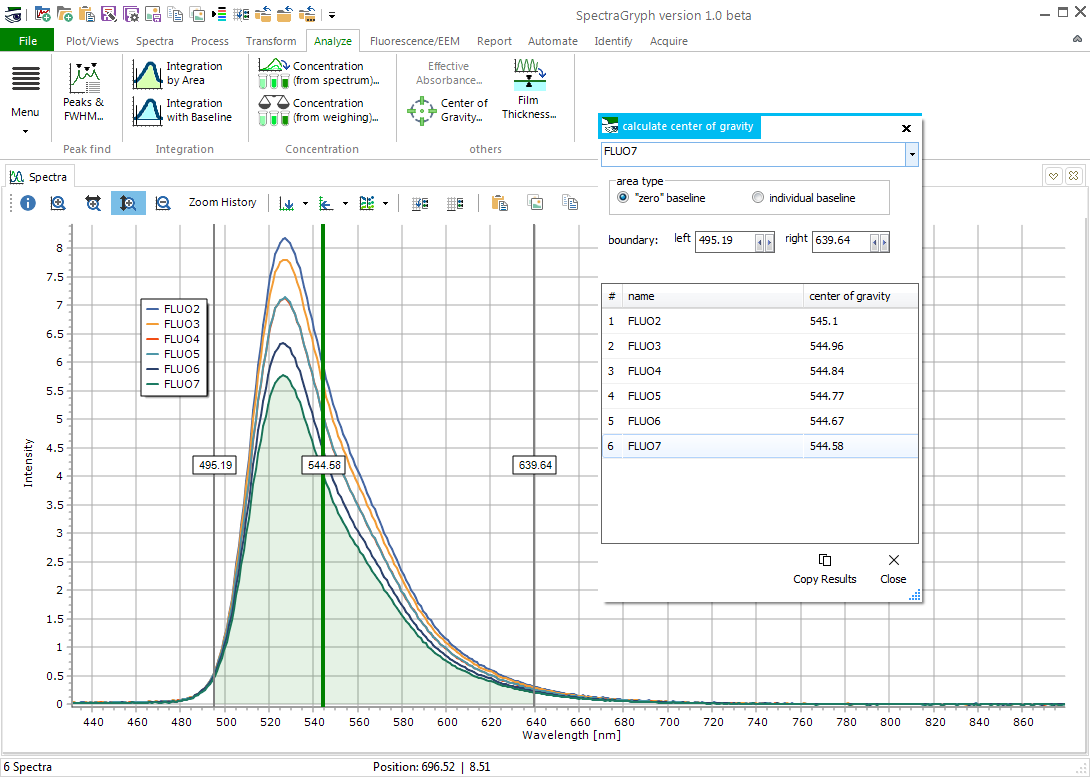
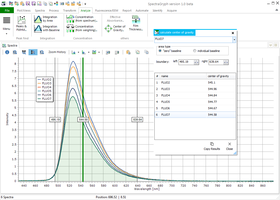
| interactive
calculation for center of gravitiy, variable limits, all spectra at
once |
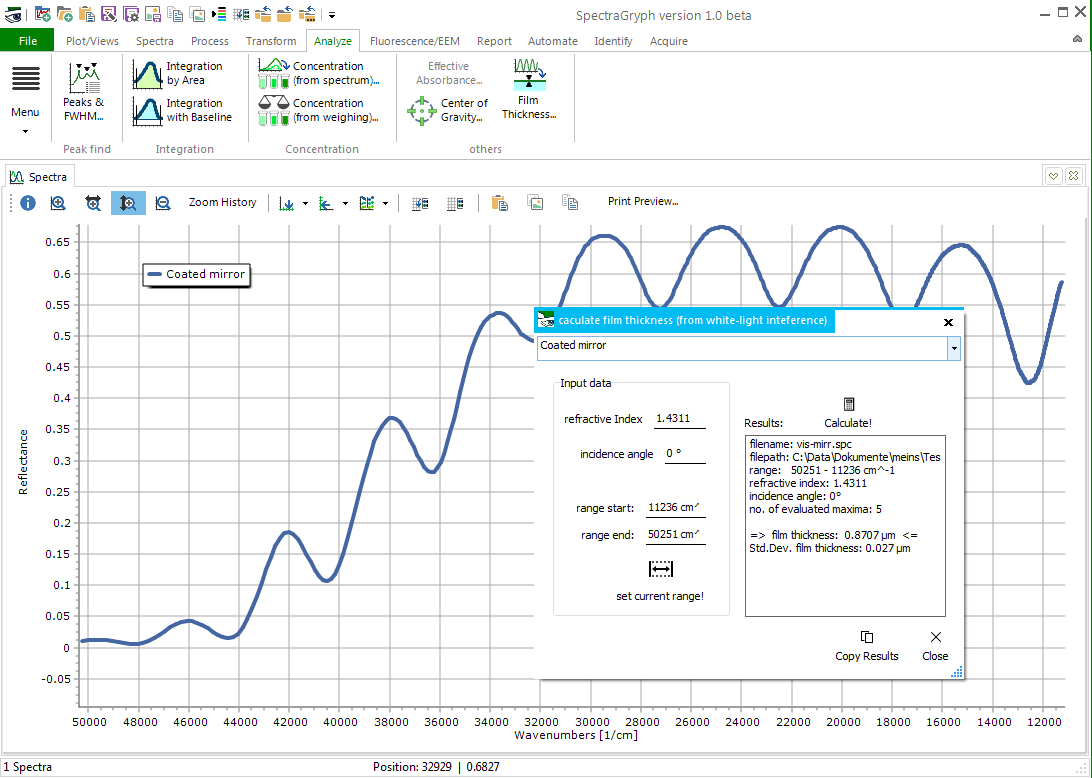
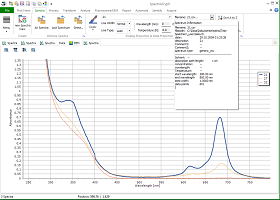
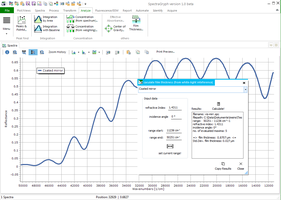
calculate
film thickness from white-light inteference spectrum |
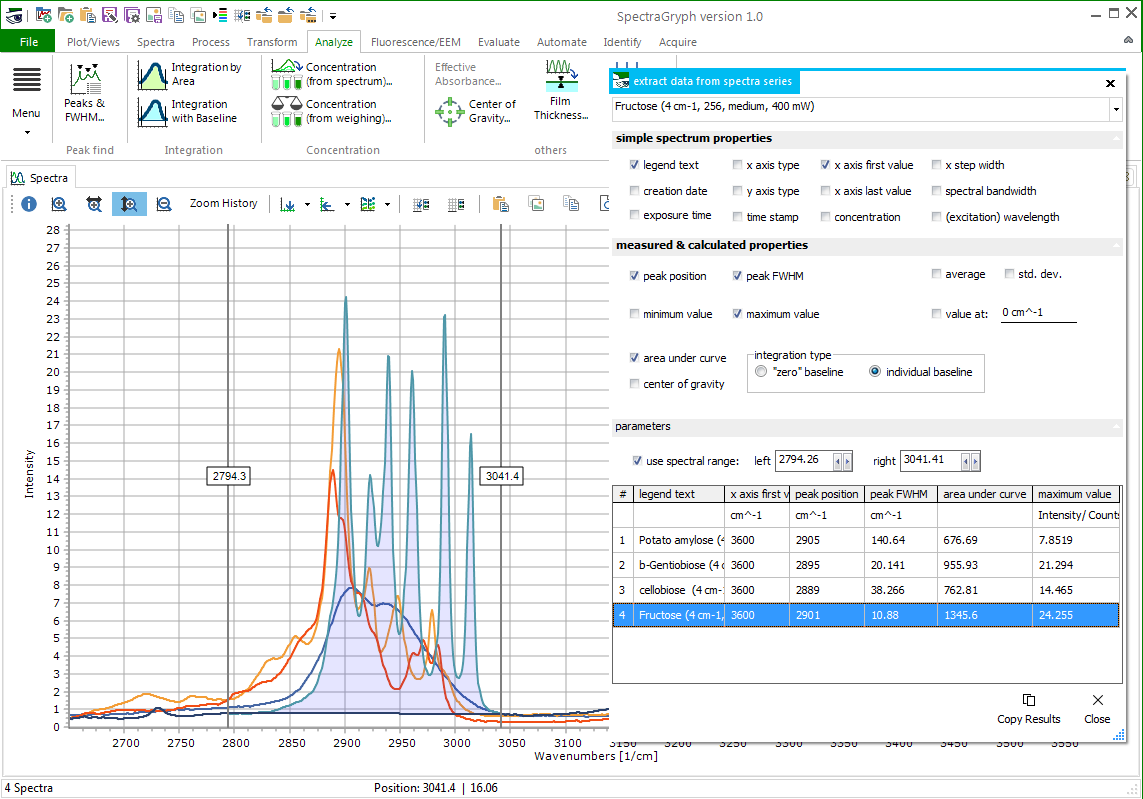
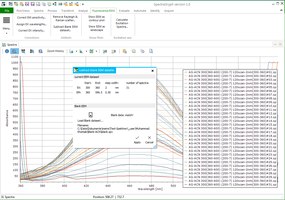
Extract
data from a spectra series (over 20 parameters) |
Remove
Blank EEM data set |
 |
 |
 |
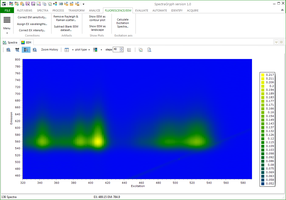 |
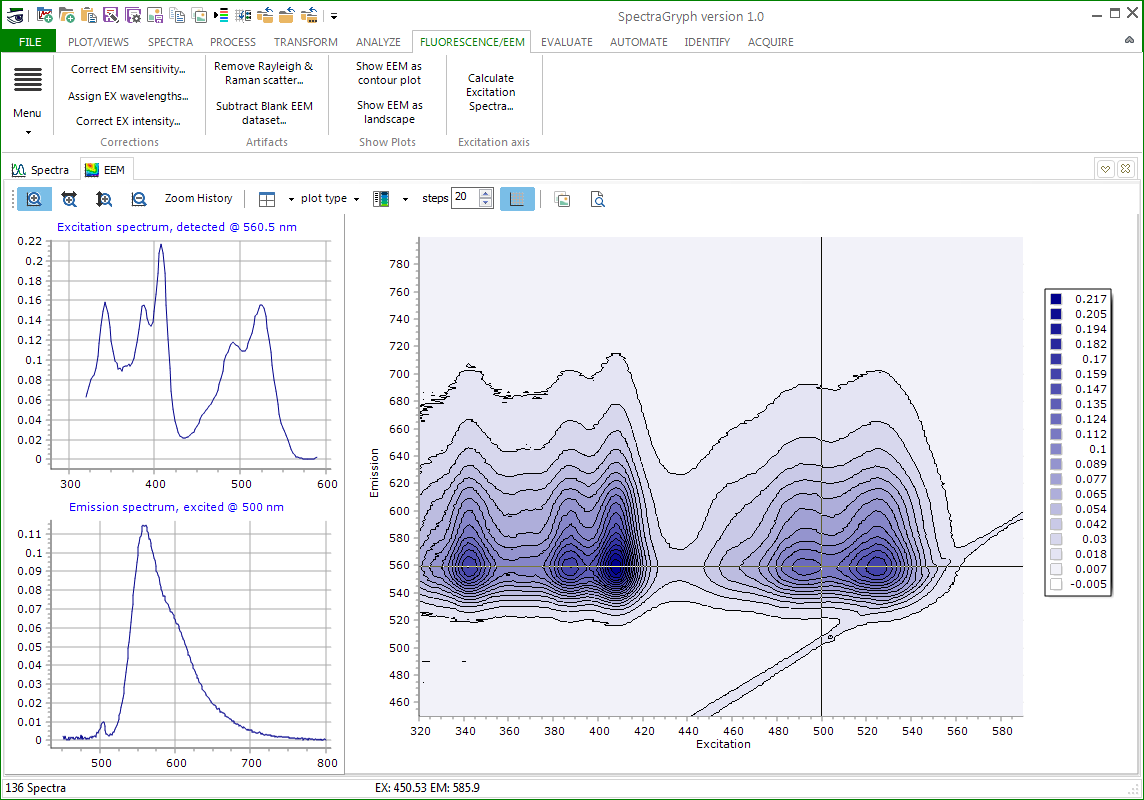
| 2-dimensional
EEM contour plot with excitation/emission cross sections displayed
at left |
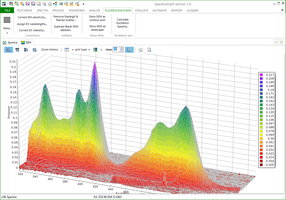
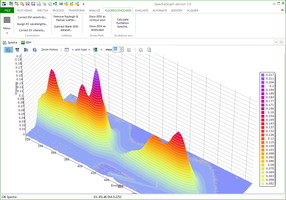
EEM
displayed as 3-dimensional surface plot |
EEM
displayed as 3-dimensional iso-surface |
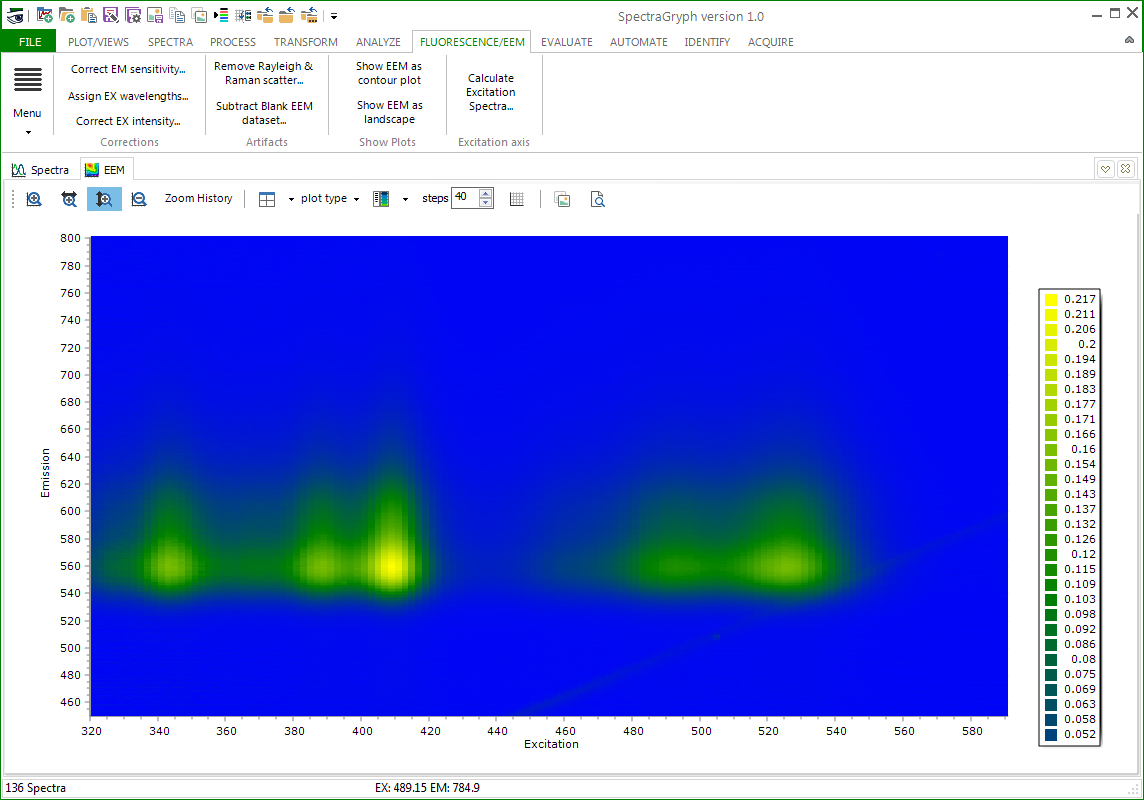
EEM
displayed as 2-dimensional colour grid |
incomprehensive listing,
more screenshots to come...
|
![[SpectraGryph]](gryphon_white_green_96.png "back to SpectraGryph main page")