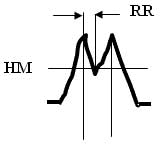
© 2017: Dr. Friedrich Menges Software-Entwicklung Spectroscopy Ninja | Spectrometer Hardware | Spectragryph Software Contact Imprint
[Spectroscopy Ninja] Spectroscopy Ninja - optical spectroscopy hardware. Powered by Stellarnet
News Applications Products Tech. Specs Price List Support/ FAQ Facebook: Spectroscopy Ninja LinkedIn: my professional self! Twitter: Spectroscopy Ninja ResearchGate: my academic self send an email my Google Plus youtube channel for Spectroscopy Ninja


Spectrometer System - General Characteristics

Optical Input:
SMA 905 connector for single strand optical fiber or probe attachment.
Sensitivity:
Dependant on detector: ILX511~80 | TCD2101~200 | S7011~10 photons per count.
Signal/Noise:
with CCD <=1000:1 with PDA<=2000:1 with InGaAs <3500:1
Stray Light:
for BLUE/GREEN-Wave < 0.1%@435nm; for BLACK-Comet <0.02%@435nm and < 0.2%@220nm
Linear Range:
0-2.1 absorbance units (< 0.5%)
Exposure Times:
Standard electronics = 4ms-60 seconds, LT-12= 2ms-60 sec, LT-14 = 1ms-60 sec
Resolution:
Depends on Model + slit selection (0.1nm-10nm); for BLACK-Comet < 0.75nm
Accuracy:
Wavelength < 0.25nm
Repeatability:
Wavelength < 0.05nm
Stability:
Wavelength < 0.001nm per Kelvin
Compensation:
StellarNet temperature compensation for detector count stabilization is software selectable. RED-Wave-NIR-InGaAs spectrometers have Thermo Electrically Cooled (TEC) detectors.


Detector Technical Specifications

File
Description
Sony ILX511 CCD detector 2048 pixels 14um wide by 200um tall
Toshiba TCD1201D PDA detector 2048 pixels 14um wide by 200um tall
InGaAs Linear Photodiode Array – cooled PDA detector 512 pixels 25um x 500um tall – range 0.9-1.7um
InGaAs Linear Photodiode Array – cooled PDA detector 1024 pixels 25um x 500um tall – range 0.9-1.7um
InGaAs Linear Photodiode Array – cooled PDA detector 512 & 1024 pixels 25um x 250um tall – extended range 0.9-2.2um


Determination of Spectral Resolution

Resolving-power Resolution (RR)

When closely spaced line emission peaks can be resolved (such as the 577+579nm Mercury doublet) and are clearly separated at Half the Max peak height (HM), the distance between the peak and where its slope intersects the HM is the resolving resolution in nanometer(s). 
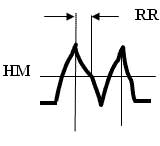
StellarNet estimates spectrometer resolution using RR. In a spectrograph with a perfectly imaged detector array, RR will be the nm/pixel dispersion. Larger slits decrease resolution as the image spreads to adjacent detector pixels.

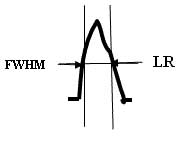
Line-width Resolution (LR)

When a single peak is measured at its Full Width Half Max (FWHM), the difference where the slopes intersect the HM is the Line-width resolution in nanometer(s). Conversion from LR to RR use: LR ~= 2 * RR.


Emission Spectra – HgAr gas and Laser/LEDs