|
Functions
of the File menu
=>
Click onto any File menu entry for descriptions
|
| |
|
|
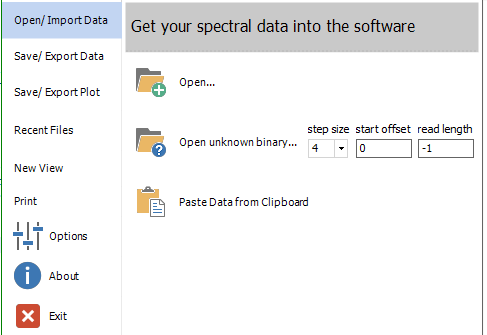
Open/ Import Data
Open
For loading
of spectral data into tabs (Spectra tab, but also Analyze and
Automate tab). Select one or several file or the whole content
of a folder. While loading the spectra, the status of the reading
procedure is displayed in the middle part of the status bar. If
possible, the plot's x and y axis types are chosen according to
the most recently opened spectral file. Currently, 89 different
file formats are recognized, as listed here.
Alternatively,
use the CTRL+O short key, or the File Open button from the quick
access toolbar at the top, or simply drag&drop files from
Windows Explorer onto the Spectragryph window. If a file type
is assigned to Spectragryph in Windows Explorer, double-clicking
such file will also open it.
Open unknown
binary
This opens a
interprets a binary "as if", looking at it as if it
were a number of different data types and puts the results as
a table into clipboard. Additionally, an Excel template file is
opened that is formatted to display all those data types in a
useful way. Probably only usefuly for me, the developer:-)
Paste Data
from Clipboard
This will transfer
arbitrary data from Excel or Origin or even any text editor into
a Spectragryph plot. Required are at least two columns, where
at least one contains the x axis values. Just select the desired
range of data, and copy&paste into Spectragryph.It works with
multiple columns, "x y y y" and "x y x y x y"
arrangements are accepted (it will ask you, if three or more columns
are found). Axis types can be defined in the line above the data
columns. If no axis information is found, default axis types are
used (usually: "wavelength" and "absorbance",
to be defined from File > Options > file open, save). Optionally,
there can be spectrum names in the line above the axis type descriptions.
|
| |
<jump
back to top> |
|
|
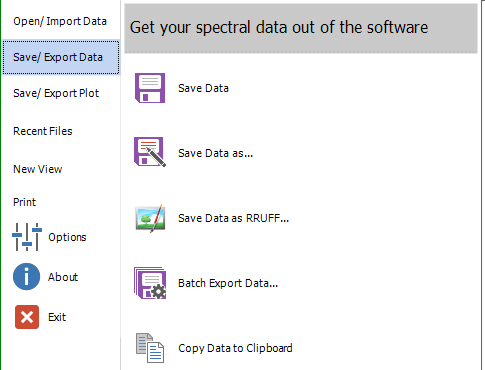
Save/ Export Data
Save Data
For saving data
into the same filename as used previously. If no files were saved
before, it behaves like Save Data as (explained
below).
Save Data as
For saving spectral
data. Currently, seven file formats are available:
- sgd file: for fast and space-saving storage and reloading
of spectra, meta data and line thickness/ colour/ ttype are preserved.
- spv file: similar to sgd, but for the previous Spekwin32
software
- spc file: for saving of single spectra as Thermo
GRAMS binary files, a quasi-standard, widespread file format,
introduced by Galactic
Corporation in the 1990s.
- dx/jdx files: for saving single spectra in the worldwide
used standard file format JCAMP-DX,
proposed and maintained by IUPAC.
- dat file: for saving multiple spectra as ASCII data for
import into graphing software like Origin or Sigmaplot. Multiple
spectra get interpolated to a common x column. As x values, both
wavelength and wavenumber data are saved (as first and second
column). Sample file.
- csv file: for saving multiple spectra as ASCII data for
import into other software, like Excel. Multiple spectra get saved
as x,y -paired columns, with individual axis types and spectrum
names in the header above the data columns. Sample
file.
- nir file: for saving NIR reflectance data into the binary
FOSS
file format. Please use only for this kind of spectra (tested
with Bruker NIR spectra).
Save Data as
RRUFF
For saving Raman
spectra into the native data file format for the RRUFF
minerals database. Their software CrystalSleuth allows to
create and maintain your own searchable minerals Raman spectra
database.Select the spectrum to be exported in the upper dropdown
list, use parameters from the input file or put them in yourself.
Well, this was nice when it got created in 2015... By now, Spectragryph
itself has spectra library search, which performs about 100 times
faster and has more options. Also, a ready-to-use Spectragryph
library complied from the RRUFF data can be downloaded here.
Batch Export
Data
Export all loaded
spectra as single spectrum files into one of five file formats
(*.spc, *.dx, *.csv, *.spg, *.nir). Additionally, all spectra
can be exported together as multi-spectrum file (same file formats).
File location: save the files in the same location (the file pathes
where the original spectrum files were located), or else together
at the filepath defined in the edit box below. A new file name
can be defined together with attached successive numbering, or
else the legend texts can be used as filenames. Combine both options
by selecting both. The Export! button starts the
file export process; the progress will be shown in the text field
and with a progress bar below..
Copy Data to
Clipboard
Copy all data
from all current spectra to the clipboard. From there, it can
be pasted into text processing or spreadsheet software (like Microsoft
Excel or Origin). Spectral data will usually be saved in x..y..x..y..x..y..
format (each spectrum has its own paired xy values). Only in case
all spectra have the same x values, the format will be x..y..y..y..
(that is: one x column for all spectra). The first line contains
the legend texts, second line contains x and y axis type for each
spectrum. Actually, the same data structure as saved csv files.
|
| |
<jump
back to top> |
|
|
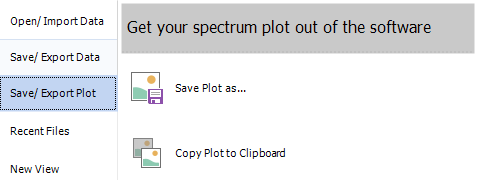
Save/ Export Plot
Save Plot as
Save the current
spectral plot as image file. There are 7 data file formats to
select from:
- bmp
format for saving as lossless pixel graphics with the current
resolution, big files.
- emf/ wmf format for saving as freely scalable vector
graphics of small file size, recommended for Windows Office apps
(Word, PowerPoint).
- eps format: for saving as a "enhanced post script"
file, relatively small with great resolution, because it is vectorized
- pdf format: for saving as "portable document file".
Do I need to explain that?
- svg format: for saving as "scalable vector graphics",
great for processing in vector-capable image processing software,
like Inkscape
- png format for saving as small lossless compressed files,
has largely replaced jpg format, resolution: 2000x1000 Pixel.
Hints
for optimized graphics export: With maximized program window,
the standard axis and legend fonts might look rather small in
saved graphics. Try saving from a medium-sized Spectragryph window.
A line width of 3 might give the best visibility for the spectrum
traces.
Copy Plot to
Clipboard
Current graph
window is copied to the clipboard as a vector graphics. From there,
it can be pasted into graphic or text processing software. On
pasting into Excel and Powerpoint, for example, the image data
will be accepted and handled as vectorized image data. For optimized
graphics see Save Plot as (above)
|
| |
<jump
back to top> |
|
|
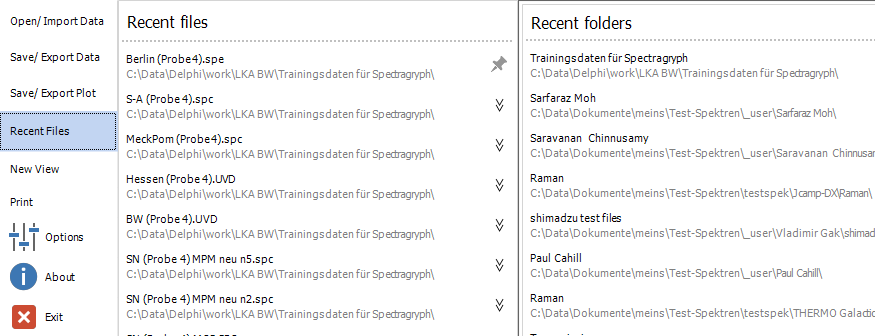
Recent Files
The software
keeps track of 20 recently used files and folders. Here, you can
quickly retrieve and load a recently used file on the left ("Recent
files"), or start opening files from a recently used
folder ("Recent folders"). The pinning function
is currently inactive.
|
| |
<jump
back to top> |
|
|
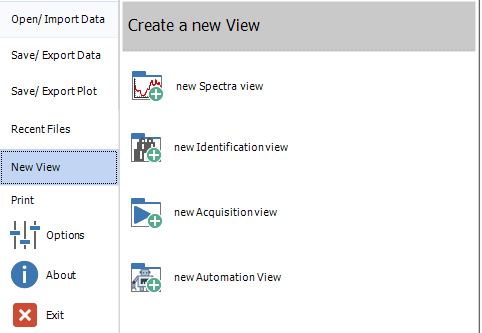
New View
Here you can
create a new view (plot tab). Same can be done from the New
View button from the Plot/Views
ribbon. Also, each topic ribbon has a Create button for the
assigned type of view tab. Several view types can be created from
here:
- Spectra view: general use view for visualizing spectra.
This is the tab type underlying all other, more specialized tab
types.
- Identification view: special view for creating and using
spectral libraries. Its sub-tabs contain two spectra views for
reference spectra and results display. The Identify
ribbon has the special functions for handling libraries.
- Acquisition view: special view used for spectra acquisition
from a controlled spectrometer. The Acquire
ribbon has the special functions for spectrometer control
and spectra acquisition.
- Automation view: special view for setting up and running
automated spectra processing sequences. It is controlled by the
Automate ribbon.
|
| |
<jump
back to top> |
|
|
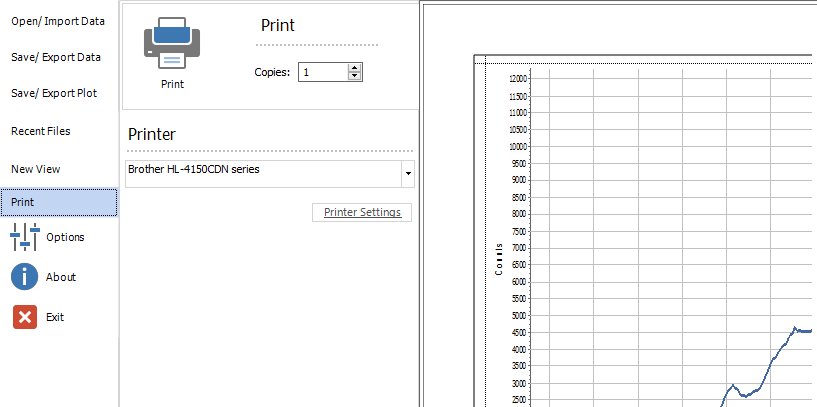
Print
For printing
the current plot. On the right, it shows a printing preview. The
middle area has printer selection, number of copies and access
to printer settings. The big Print button will actually
start the printing process.
As an alternative way of printing, you can do printing directly
from the spectra tab: there is a Print Preview button
as part of the top button row above each spectra plot. It even
has additional options.
|
| |
<jump
back to top> |
|
|
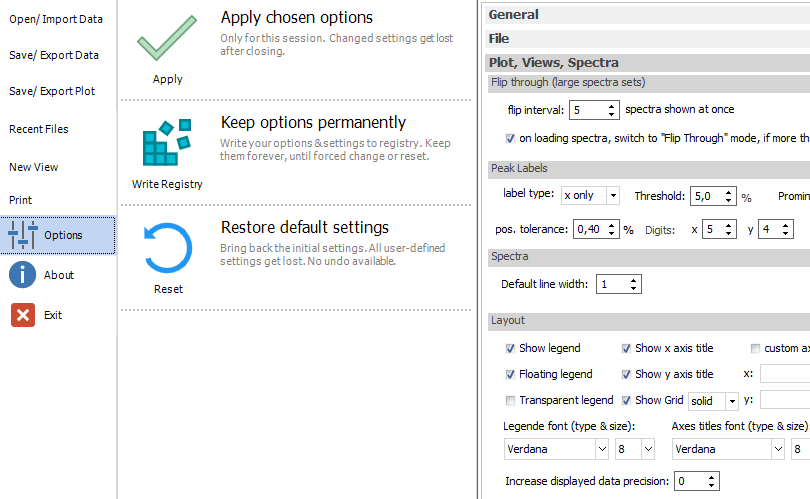
Options
This gives access
to 175 user-definable software settings from all areas of the
software. When the options are showing, all entries show the current
state of those settings. Just click on any of the topics, to show
the respective settings collection.
After changing
settings, you can apply the current state of settings for the
current session by clicking the Apply chosen options button.
These changes will only be effective until the software is closed.
After restart, it will come up with the previous state of settings.
For making changed
settings permanent, click the Keep options permanently button,
the new state of settings will then be kept in registry and applied
on each software start.
For going back
to factory default settings, click the Restore default settings
button.
|
| |
<jump
back to top> |
|
|
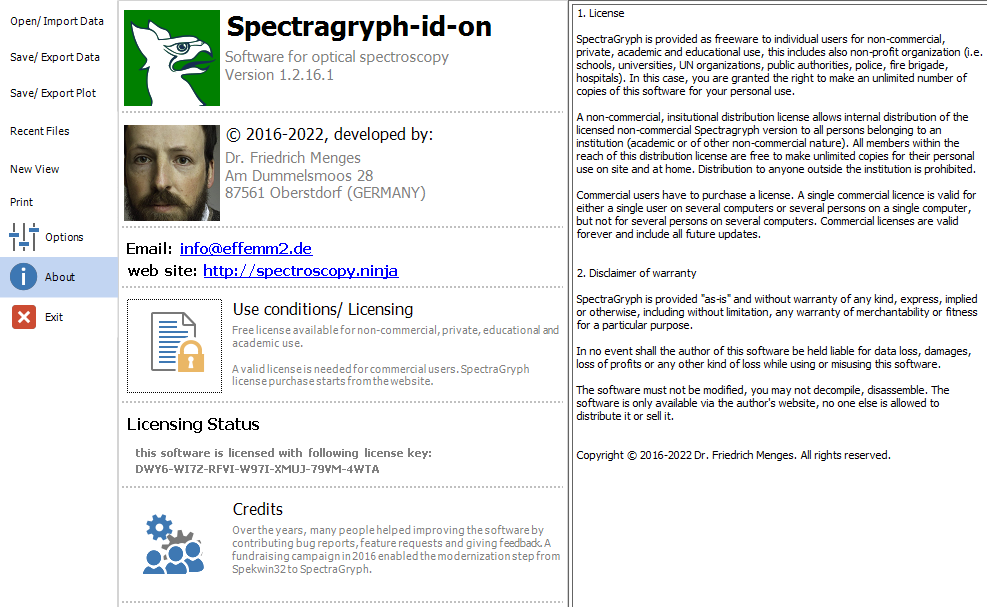
About
In the About
section, you get information about the software, explained from
top:
- the software
name and version. The standard version is simply called "Spectragryph",
while the "-id" extension is appended for the spectral
library search option and "-on" is appended for the
spectrometer control option.
- the copyright
and author statement
- Email and
website links
- the use conditions/
terms of use, shown at right after clicking the button
- the licensing
status: trial verison or licensed. For licensed state, the actual
license key is shown. For doing the license activation, click
the Activate button in the green startup window
and follow the instructions.
- the Credits:
on clicking the big button, on the right some information is shown
about persons that were influential and helpful with their support
throughout the stages of my software development during over 20
years, including those who contributed to my fundraising towards
the initial development of the new Spectragryph software, starting
in 2016.
|
| |
<jump
back to top> |
|

|
Exit
The Exit
button closes the software, without any further "Should
it really close" request. Alternatively, you can use the
miniature Close button on the software window's upper right corner,
or the Windows standard ALT+F4 short key, or the software's
CTRL+Q short key.
HINT: for closing
a single tab, click the miniature close button, or the Close
view button from the Plot/Views
ribbon or use the CTRL+W short key.
|
| |
<jump
back to top> |
|
![[SpectraGryph]](gryphon_white_green_96.png "back to SpectraGryph main page")